Issues I met when running NutchIndexing and How I fixed them
1. Background
Recently I set up a Big Data cluster (using Bigtop 1.3.0) with three Arm servers and tried to HiBench. My goal is to make all menchmarkings in HiBench 7.0 run and pass on Arm servers. It all went well until it comes to NutchIndexing.
NutchIndexing is a benchmark which "tests the indexing sub-system in Nutch, a popular open source (Apache project) search engine. The workload uses the automatically generated Web data whose hyperlinks and words both follow the Zipfian distribution with corresponding parameters. "
This post lists all the issues I met when running NutchIndexing, and also how I fixed them.
Information about how to setup a cluster with Bigtop 1.3.0 and how to install and run HiBench7.0, please see my other posts, listed here.
Overall, my test set up is like this, with 'Head Node' is master, and 'Node 2' and 'Node 3' are slaves. From here on, I will refer them as node-001, node-002, and node-003.

Profile size I tested is 'large', which means 1,000,000,000 Web pages to index. Specify it in [HiBench]/conf/hibench.conf
$ ./bin/workloads/websearch/nutchindexing/prepare/prepare.sh
$ ./bin/workloads/websearch/nutchindexing/hadoop/run.sh
Within prepare.sh, it contains two map/reduce cycles. I call them stage 1 and stage 2:
- Create nutch urls
- Create nutch index data
Here comes issues I met, in chronological order. Happy reading.
2. Issue: Beyond Physical Memory Limits
The first error I ran into is this:
18/12/04 19:26:50 INFO mapreduce.Job: Task Id : attempt_1543902147522_0030_m_000003_0, Status : FAILED
Container [pid=22067,containerID=container_1543902147522_0030_01_000005] is running beyond physical memory limits. Current usage: 1.0 GB of 1 GB physical memory used; 3.1 GB of 100 GB virtual memory used. Killing container.
Checking file: HiBench/report/nutchindexing/prepare/conf/nutchindexing.conf
# Source: Probed by configuration file:'/usr/lib/hadoop/etc/hadoop/mapred-site.xml'
MAP_JAVA_OPTS='-Xmx1024m'
RED_JAVA_OPTS='-Xmx1024m'
In file: /usr/lib/hadoop/etc/hadoop/mapred-site.xml, I found these two parameters:
To fix, modity the above to 4096m (4GBytes). Note: need to modify on ALL datanodes.
$ sudo vi /usr/lib/hadoop/etc/hadoop/mapred-site.xml
:find 'mapreduce.map.java.opts', and 'mapreduce.reduce.java.opts', and change them to -Xmx4096m
But, although I checked 'YarnChild' run with -Xmx4096m, it still fails with '1.0 GB of 1 GB physical memory used'.
bigtop-deploy/puppet/modules/hadoop/templates/mapred-site.xml
bigtop-deploy/puppet/modules/hadoop/manifests/init.pp
$mapreduce_map_memory_mb = undef,
$mapreduce_reduce_memory_mb = undef,
$mapreduce_map_java_opts = "-Xmx1024m",
$mapreduce_reduce_java_opts = "-Xmx1024m",
The setting mapreduce.map.memory.mb will set the physical memory size of the container running the mapper (mapreduce.reduce.memory.mb will do the same for the reducer container).
bigtop-deploy/puppet/modules/hadoop/templates/yarn-site.xml
bigtop-deploy/puppet/modules/hadoop/manifests/init.pp
$yarn_nodemanager_resource_memory_mb = undef,
$yarn_scheduler_maximum_allocation_mb = undef,
$yarn_scheduler_minimum_allocation_mb = undef,
YARN allocates memory only in increments/multiples of yarn.scheduler.minimum-allocation-mb.
More investigation leads this to surface: https://dzone.com/articles/configuring-memory-for-mapreduce-running-on-yarn
(in MapReduce a container is either a map or reduce process).
For MapReduce running on YARN there are actually two memory settings you have to configure at the same time:
- The physical memory for your YARN map and reduce processes
- The JVM heap size for your map and reduce processes
Updated on all datanodes:
$ sudo vi bigtop-deploy/puppet/modules/hadoop/templates/yarn-site.xml
3. Issue: reduce job timeout
After increase memory to 4GB, map task can run successfully. However, reduce job fails due to 'time out'. In 'htop', Mem shows all yellow, almost full, meaning occupied by disk file cache. CPU most of them are idle; Load averages of 1/5/15 minutes are 0, 0.02, and 0.4.
On Datanode node-003, type in:
$ cat /proc/meminfo
MemTotal: 131748724 kB
MemFree: 429644 kB
MemAvailable: 128579616 kB
Buffers: 0 kB
Cached: 124877652 kB
$ free -h
total used free shared buff/cache available
Mem: 125G 2.0G 418M 8.6M 123G 122G
Swap: 4.0G 0B 4.0G
Log HiBench/report/nutchindexing/prepare/conf/../bench.log goes:
18/12/10 13:09:08 INFO mapreduce.Job: Job job_1543902147522_0036 failed with state FAILED due to: Application application_1543902147522_0036 failed 2 times due to ApplicationMaster for attempt appattempt_1543902147522_0036_000002 timed out. Failing the application.
18/12/10 13:09:08 INFO mapreduce.Job: Counters: 0
Exception in thread "main" java.io.IOException: Job failed!
at org.apache.hadoop.mapred.JobClient.runJob(JobClient.java:873)
at HiBench.NutchData.createNutchIndexData(NutchData.java:477)
at HiBench.NutchData.generate(NutchData.java:516)
at HiBench.DataGen.run(DataGen.java:34)
at org.apache.hadoop.util.ToolRunner.run(ToolRunner.java:76)
at HiBench.DataGen.main(DataGen.java:45)
at sun.reflect.NativeMethodAccessorImpl.invoke0(Native Method)
at sun.reflect.NativeMethodAccessorImpl.invoke(NativeMethodAccessorImpl.java:62)
at sun.reflect.DelegatingMethodAccessorImpl.invoke(DelegatingMethodAccessorImpl.java:43)
at java.lang.reflect.Method.invoke(Method.java:498)
at org.apache.hadoop.util.RunJar.run(RunJar.java:234)
at org.apache.hadoop.util.RunJar.main(RunJar.java:148)
Is this related to:
- mapreduce.task.timeout
- yarn.am.liveness-monitor.expiry-interval-ms
- yarn.nm.liveness-monitor.expiry-interval-ms
- Yarn.resourcemanager.nm.liveness-monitor.interval-ms
bigtop-deploy/puppet/modules/hadoop/templates/yarn-site.xml:
yarn.nodemanager.vmem-check-enabled
bigtop-deploy/puppet/modules/hadoop/manifests/init.pp:
$yarn_nodemanager_vmem_check_enabled = undef
Fix:
Add on ALL datanodes, disable the nodemanager vmem check:
$ sudo vi /usr/lib/hadoop/etc/hadoop/yarn-site.xml
- If this parameter is set to true, the job is stopped if a container is using more than the virtual limit that the user specifies. Set this parameter to false if you do not want jobs to fail when the containers consume more memory than they are allocated.
Having all of these above parameters set, reduce job can run without timeout. However, only node-001 has 100% cpu load, others node-002, node-003 are very low cpu load, about 0%~5%. iftop shows network traffic are low as well, less than 10Kb.
4. Issue: CPU load averages are very low
Continue from above. After many minutes, 'iftop' shew that network traffic starts increasing to a level of 897Mb (peak) among all three datanodes. RX+TX rate is about 1.2Gb on all nodes. CPU loads are still low though.
After that, a new job starts, however, CPU loads, network traffic, or hard disk i/o are all at a very low level. Once every few minutes, I can observe the Namenode (process) got a high CPU load load such as 3000%, then several seconds after, it goes to low load <5 again.="" span="">
Don't understand why.
Tried: set mapper to 8; reducer to 1.
$ vi conf/hibench.conf
hibench.default.map.parallelism 8
hibench.default.shuffle.parallelism 1
But the problem remains. Need more investigation.
5. Issue: AttemptID Timed out after 600 secs - Part I
Start nutchindexing/prepare.sh again. It contains two stages:
- Create nutch urls
- Create nutch index data
Stage 1 finished without error.
At the Stage 2, some error messages popped up, and progress stopped at 42%:
…
18/12/11 13:09:35 INFO mapreduce.Job: Task Id : attempt_1543902147522_0043_m_000003_0, Status : FAILED
AttemptID:attempt_1543902147522_0043_m_000003_0 Timed out after 600 secs
...
Refer to:
- https://blog.csdn.net/ChaosJ/article/details/53106524
- https://community.cloudera.com/t5/Batch-Processing-and-Workflow/Multiple-Tasks-attempts-FAILED-in-YARN-Timed-out-after-600/td-p/61380
to get some clues.
Here it leads me to use a new tool 'jstack' to check a running Java process.
5.1. Jstack -l
$ sudo -u yarn jstack -l 18792
Comparing application run on all nodes, and noticed the MRAppMaster container(pid: 18163) is running with only 1GB memory. YarnChild app is pid:18792. `top -p 18792` shows it always uses >100% CPU. (On the other two nodes, YarnChild CPU usages are as low as 10%).
Zoom in to 18792.
$ ps -ef | grep application_1543902147522_0043
Man page: jstack - Prints Java thread stack traces for a Java process, core file, or remote debug server. This command is experimental and unsupported.
A JVM Thread Dump is a snapshot taken at a given time which provides you with a complete listing of all created Java Threads.
Thread stack dump
$ jstack -l [pid] > thread-sampling.tdump
Note: can get from `sudo jps -lv`.
Eg.
$ sudo -u yarn jstack -l 18792
Note: About why there are 43 "GC task thread" (from no. 18794 to no. 18836, see next section), it's related to the cores you have: "-XX:ParallelGCThreads --> No. of Parallel GC threads. By default, the GC threads will be equal to the number of CPUs of the Node / VM. Used when Parallel Garbage collectors are configured."
Since there are so many threads in the 18792 java vm, in next step, I need to examine in detail what these threads are, and which costs most of the resources, or which blocks others and how.
5.2. 'Top -H -p '
Using 'top -H -p ' to list Java process' per thread CPU usage.
$ sudo ps uH -p
or,
$ top -H -p
'top -H' command is more useful. In this case, I found these threads use the most %CPU:
18793 (100%) + 18878 (2%)
-> 18793 (100%)+18887(100%)
-> 18887 (100%) <=== after 3 minutes
-> 18887 (100%) +18878 (2%) (most cpu cores are idling)
18797.. (when most cpu cores are full)
18 793 = 0x4969 "main"
18 887 = 0x49c7 "SpillThread"
18 878 = 0x49be "communication thread"
18 860 = 0x49ac "VM Periodic Task Thread"
18 794 = 0x496a
... …
18 836 = 0x4994
18794~18836: These are "GC task thread#0 (ParallelGC)" os_prio=0 tid=0x0000ffff98066800 nid=0x496a runnable, and pop up every few minutes, and each takes about one CPU core 100%.
$ sudo -u yarn jstack -l 18792 | grep '496d\|49c7\|49be\|49ac\|4969'
"SpillThread" #39 daemon prio=5 os_prio=0 tid=0x0000ffff9983b800 nid=0x49c7 runnable [0x0000ffff67618000]
"main" #1 prio=5 os_prio=0 tid=0x0000ffff98054000 nid=0x4969 waiting on condition [0x0000ffff9e813000]
"communication thread" #34 daemon prio=5 os_prio=0 tid=0x0000ffff9978b800 nid=0x49be in Object.wait() [0x0000ffff67e19000]
"VM Periodic Task Thread" os_prio=0 tid=0x0000ffff981c5000 nid=0x49ac waiting on condition
"GC task thread#3 (ParallelGC)" os_prio=0 tid=0x0000ffff9806c000 nid=0x496d runnable
6. Issue: Chasing down 'SpillThread'
Among these threads, I found spillthread more suspicious. Check what it is.
In general:
- Spilling happens when there is not enough memory to fit all the mapper output. Amount of memory available for this is set by `mapreduce.task.io.sort.mb`
- It happens when 80% of the buffer space occupied because the spilling is done in a separate thread, not to interfere with mapper. If the buffer reaches 100% utilization, the mapper thread has to stop and wait for the spilling thread to free up the space. To avoid this, the threshold of 80% is chosen
- Spilling happens at least once, when the mapper finished, because the output of the mapper should be sorted and saved to the disk for reducer processes to read it. And there is no use to invent a separate function to the last "save to disk", because in general it does the same task
Since 'SpillThread' so frequently jumps out and eats CPUs, I decided to give `mapreduce.task.io.sort.mb` an increase first.
Mapreduce.task.io.sort.mb defaults to 256. Increased it to 1600MB, which is about 50% of total heap size (which I previously set to 3276M). I expect this can make application doesn't need to spill that often.
In File:
$ sudo vi /usr/lib/hadoop/etc/hadoop/mapred-site.xml
After this parameter is changed, please restart ResourceManager:
$ sudo systemctl reload-or-restart hadoop-yarn-resourcemanager.service
7. A better Parameter Tunings
It was at this point, I learned that Nutchindexing is very unique in resource requirements, and default settings in Yarn and Mapreduce can not make it run.
Here is a list of steps which parameters I tuned. My main reference is from:
| yarn-site.xml | yarn.nodemanager.vmem-check-enabled |
false
|
| yarn.nodemanager.resource.cpu-vcores |
60
| |
| yarn.nodemanager.resource.memory-mb | ||
| yarn.scheduler.minimum-allocation-vcores |
1
| |
| yarn.scheduler.maximum-allocation-vcores |
60
| |
| yarn.scheduler.increment-allocation-vcores |
1
| |
| yarn.scheduler.minimum-allocation-mb |
1024
| |
| yarn.scheduler.maximum-allocation-mb |
16384
| |
| yarn.scheduler.increment-allocation-mb |
1024
|
| mapred-site.xml | yarn.app.mapreduce.am.resource.mb |
8192
|
| mapreduce.map.memory.mb |
8192
| |
| mapreduce.reduce.memory.mb |
8192
| |
| mapreduce.map.java.opts |
-Xmx6400m
| |
| mapreduce.reduce.java.opts |
-Xmx6400m
| |
| mapreduce.task.io.sort.mb |
1000
| |
| mapreduce.map.cpu.vcores |
1
| |
| mapreduce.reduce.cpu.vcores |
1
|
Increase Container memory to 8GB, JVM heap memory to 6400MB
Count of mapper jobs to 8, reducer jobs to 1.
8. Issue: 'mapreduce.task.io.sort.mb' must be less than 2047
Problem: mapreduce.task.io.sort.mb is hardcoded to not allow values larger than 2047. If you enter a value larger then this the map tasks will always crash at this line:
Then I change sort.io to 2000MB (only changed in master node). Using 'small' profile (1M web pages). Rerun: succeed.
Note, when runing 'nutchindexing/hadoop/run.sh': it needs to install zip: yum install zip.
However, when I ran Nutchindex 'large' profile (1G web pages). Failed again in prepare.sh.
I saw two errors: @
- AttemptID: ... Timed out after 600 secs
- Error: java.io.IOException: Spill failed,
at org.apache.hadoop.mapred.MapTask$ MapOutputBuffer.checkSpillException (MapTask.java:1564)
Log:
18/12/16 01:03:23 INFO mapreduce.Job: map 8% reduce 0%
18/12/16 01:11:15 INFO mapreduce.Job: Task Id : attempt_1544837879404_0013_m_000001_1000, Status : FAILED
AttemptID:attempt_1544837879404_0013_m_000001_1000 Timed out after 600 secs
18/12/16 01:20:26 INFO mapreduce.Job: Task Id : attempt_1544837879404_0013_m_000000_1000, Status : FAILED
Error: java.io.IOException: Spill failed
at org.apache.hadoop.mapred.MapTask$MapOutputBuffer.checkSpillException(MapTask.java:1564)
at org.apache.hadoop.mapred.MapTask$MapOutputBuffer.flush(MapTask.java:1473)
at org.apache.hadoop.mapred.MapTask.runOldMapper(MapTask.java:460)
at org.apache.hadoop.mapred.MapTask.run(MapTask.java:343)
at org.apache.hadoop.mapred.YarnChild$2.run(YarnChild.java:175)
at java.security.AccessController.doPrivileged(Native Method)
at javax.security.auth.Subject.doAs(Subject.java:422)
at org.apache.hadoop.security.UserGroupInformation.doAs(UserGroupInformation.java:1840)
at org.apache.hadoop.mapred.YarnChild.main(YarnChild.java:169)
Caused by: java.io.EOFException
at java.io.DataInputStream.readByte(DataInputStream.java:267)
at org.apache.hadoop.io.WritableUtils.readVLong(WritableUtils.java:308)
at org.apache.hadoop.io.WritableUtils.readVInt(WritableUtils.java:329)
at org.apache.hadoop.io.Text.readFields(Text.java:290)
at org.apache.hadoop.io.serializer.WritableSerialization$WritableDeserializer.deserialize(WritableSerialization.java:71)
at org.apache.hadoop.io.serializer.WritableSerialization$WritableDeserializer.deserialize(WritableSerialization.java:42)
at org.apache.hadoop.mapred.Task$ValuesIterator.readNextKey(Task.java:1537)
at org.apache.hadoop.mapred.Task$ValuesIterator.(Task.java:1473)
at org.apache.hadoop.mapred.Task$CombineValuesIterator.(Task.java:1567)
at org.apache.hadoop.mapred.Task$OldCombinerRunner.combine(Task.java:1697)
at org.apache.hadoop.mapred.MapTask$MapOutputBuffer.sortAndSpill(MapTask.java:1639)
at org.apache.hadoop.mapred.MapTask$MapOutputBuffer.access$900(MapTask.java:876)
at org.apache.hadoop.mapred.MapTask$MapOutputBuffer$SpillThread.run(MapTask.java:1534)
Checking log files on node-003, find:
$ sudo tail -f /var/log/hadoop-yarn/containers/application_1544837879404_0019/container_1544837879404_0019_02_000001/syslog
Reduce slow start threshold not met. completedMapsForReduceSlowstart
Reboot yarn services
$ sudo systemctl reload-or-restart hadoop-yarn-nodemanager.service
$ sudo systemctl reload-or-restart hadoop-yarn-resourcemanager.service
Still stalls. Log message in container_1544971968987_0002_02_000001/syslog:
... TaskAttemptListenerImpl: Progress of TaskAttempt …
(all other containers on all nodes were looking ok, except printing 'spill' every half hour or so).
9. Issue: AttemptID Timed out after 600 secs-Part II
Also, I changed mapper number to 45, and reducer number to 3. Prepare.sh stalls at Stage 2 after map 67%. Disk I/O on all three nodes are busy: node-001 and 003 write, node-002 read.
node-001 cpu all cores are about 100%.
There are 14 containers being killed by AM.
18/12/17 14:35:44 INFO mapreduce.Job: Task Id : attempt_1544971968987_0005_m_000010_1000, Status : FAILED
AttemptID:attempt_1544971968987_0005_m_000010_1000 Timed out after 600 secs
Container killed by the ApplicationMaster.
Container is killed before being launched.
Seeing the same failure for repetitive log, this time on node 002:
container_1544971968987_0005_02_000001/syslog
2018-12-17 16:00:26,825 INFO [IPC Server handler 16 on 45735] org.apache.hadoop.mapred.TaskAttemptListenerImpl: Progress of TaskAttempt attempt_1544971968987_0005_m_000042_1000 is : 0.667
Log messages:
18/12/17 14:46:13 INFO mapreduce.Job: Task Id : attempt_1544971968987_0005_m_000036_1001, Status : FAILED
AttemptID:attempt_1544971968987_0005_m_000036_1001 Timed out after 600 secs
Container killed by the ApplicationMaster.
Container is killed before being launched.
These message finally leads me to this parameter:
mapreduce.task.timeout
default: 600 000 (ms)
The number of milliseconds before a task will be terminated if it neither reads an input, writes an output, nor updates its status string. A value of 0 disables the timeout.
Changing this timeout to a longer value seems to be an obvious solution. However, I do need to understand why it takes such a long time. I saw this suggestion: "... do the few tasks that hang all run on the same host or specific set of hosts among all nodes in the cluster?". So, I checked.
10. Chasing down logs: ApplicationAttemp and Containers.
In this section I explain Method to map 'attempt' to 'container' then 'node'. Follow this chain, I found that all the failed Application Attempts happened on node node-003.
Steps:
- First you know which task attempt you wants to analyze. Say 'attempt_1389385968629_0026_m_000008_0'.
- Locate which container is running the application master service. Usually it is the container no. 1. Go into this container's log directory, and check its syslog. (./
/ /syslog)
Eg. # cd containers/application_1544971968987_0008/container_1544971968987_0008_01_000001
# vi syslog
- Grep for "to
" to see what container was assigned this attempt ID. You will see message like this "Assigned containerto ".
Eg. "Assigned container container_1389385968629_0026_01_000010 to attempt_1389385968629_0026_m_000008_0"
- Grep for "
on NM" to find which node this container is running on.
Eg. "TaskAttempt: [attempt_1389385968629_0026_m_000008_0] using containerId: [container_1389385968629_0026_01_000010 on NM: [hdw2.hadoop.local:36429]"
11. Why all Attempts on node-003 FAIL?
So, the next problem is to find out what's wrong in node-003. Checking: root@node-003: /var/log/hadoop-yarn/yarn-yarn-nodemanager-node-003.bigtop.deploy.log
2018-12-17 14:46:26,221 INFO org.apache.hadoop.yarn.server.nodemanager.containermanager.localizer.LocalizedResource: Resource hdfs://node-001.bigtop.deploy:8020/HiBench/Nutchindexing/temp/urls/part-00003(->/home/data/yarn/filecache/70/part-00003) transitioned from DOWNLOADING to LOCALIZED
This leads me to think about downloading time for one single part is longer than 600 seconds. This blocked creation of container then run a task on node-003.
First I tried to changed 'mapreduce.task.timeout' to 0, meaning disable. Err: no progress report at all - that's essentially unacceptable; and no containers were started on node-002 and node-003 either.
Changed 'mapreduce.task.timeout' to 1200000ms. Re-run. Result was a little different.
Nutchindexing stage 1 as always, succeeded. In stage 2, node-002 and node-003 originally failed to create any container. Until after 1200 seconds timeout, application master service (which runs in container no. 1) retried to create containers on 002 and 003, and containers were successfully created at the second try. Why?
12. Issue: 'LOCALIZING', container creation failed after.
Checking node node-002's nodemanager log: 'yarn-yarn-nodemanager-node-002.bigtop.deploy.log':
- the first set of container creations failed at 'LOCALIZING'. These first batch of containers (about 17) never reaches a state of 'LOCALIZED'.
Information goes: "The NodeManager is responsible for localizing the resource prior to launching the container. "
- After 1200sec, the second set of container creations succeeded. They transitioned from 'LOCALIZING' to 'LOCALIZED', then to 'RUNNING'
- But in each container's log, they stuck at nothing after msg:
2018-12-18 11:42:14,795 INFO [main] HiBench.NutchData$CreateNutchPages: still running: 4500021 of 1000000000
2018-12-18 11:42:15,875 INFO [main] HiBench.NutchData$CreateNutchPages: still running: 4950021 of 1000000000
Examine findings A. and B, I say they are problem 1.
Finding C. is another issue, I went through it in the next section.
12.1. Problem 1: No transition from 'LOCALIZING' to 'LOCALIZED'
Worried about maybe 20 minutes are still not long enough for NMs on 002 and 003 to do localizing before containers being killed. So extend 'mapreduce.task.timeout' to 30 minutes (1,800,000 seconds). Rerun.
== mapred-site.xml
Problem Fixed.
13. Issue: AppAttempt runs very slow on node-002 and node-003
So, what about Problem 2. Containers running on node-002 and node-003 are very very slow. Processing of a batch of webpages on node-002 requires 1 hour. But on node-001, it took only 2~3 minutes.
Checked one container/ one appattempt,
On node-002 and node-003, for all containers, every one hour, it prints several new lines of "still running".
On node-001, for all containers, every 2~3 minutes, it prints several new lines of "still running".
It's clear that node-002 and 003 cannot get enough resources to run the task (what resources?). CPU load is low.
On node-003, find a YarnChild, and examine its commandline by `ps` to get its and .
# jps -l
5217 org.apache.hadoop.mapred.YarnChild
# ps -elf | grep 5217
container_1544971968987_0011_02_000022 attempt_1544971968987_0011_m_000020_1000
Use 'top -H' to find out which thread in this JVM takes most part of CPU.
# top -H -p 5217
5243 5.3% CPU.
5243 = 0x147b
# sudo -u yarn jstack -l 5217 > jstack.dump
# grep "147b" jstack.dump
"main" #1 prio=5 os_prio=0 tid=0x0000ffff88054000 nid=0x147b runnable [0x0000ffff8c3a8000]
java.lang.Thread.State: RUNNABLE
at java.io.FileInputStream.readBytes(Native Method)
at java.io.FileInputStream.read(FileInputStream.java:255)
at org.apache.hadoop.fs.RawLocalFileSystem$LocalFSFileInputStream.read(RawLocalFileSystem.java:162)
at java.io.BufferedInputStream.fill(BufferedInputStream.java:246)
at java.io.BufferedInputStream.read1(BufferedInputStream.java:286)
at java.io.BufferedInputStream.read(BufferedInputStream.java:345)
- locked <0x000000067b4f2548> (a org.apache.hadoop.fs.BufferedFSInputStream)
at java.io.DataInputStream.read(DataInputStream.java:149)
at org.apache.hadoop.fs.FSInputChecker.readFully(FSInputChecker.java:459)
at org.apache.hadoop.fs.ChecksumFileSystem$ChecksumFSInputChecker.readChunk(ChecksumFileSystem.java:258)
at org.apache.hadoop.fs.FSInputChecker.readChecksumChunk(FSInputChecker.java:299)
at org.apache.hadoop.fs.FSInputChecker.fill(FSInputChecker.java:214)
at org.apache.hadoop.fs.FSInputChecker.read1(FSInputChecker.java:255)
at org.apache.hadoop.fs.FSInputChecker.read(FSInputChecker.java:196)
- locked <0x000000067b4f1da8> (a org.apache.hadoop.fs.ChecksumFileSystem$ChecksumFSInputChecker)
at org.apache.hadoop.fs.FSInputChecker.readFully(FSInputChecker.java:459)
at org.apache.hadoop.fs.FSInputChecker.seek(FSInputChecker.java:440)
- locked <0x000000067b4f1da8> (a org.apache.hadoop.fs.ChecksumFileSystem$ChecksumFSInputChecker)
at org.apache.hadoop.fs.FSDataInputStream.seek(FSDataInputStream.java:65)
at org.apache.hadoop.fs.ChecksumFileSystem$FSDataBoundedInputStream.seek(ChecksumFileSystem.java:331)
- locked <0x000000067b4f1d70> (a org.apache.hadoop.fs.ChecksumFileSystem$FSDataBoundedInputStream)
at org.apache.hadoop.io.SequenceFile$Reader.seek(SequenceFile.java:2688)
- locked <0x000000067b4f1b90> (a org.apache.hadoop.io.SequenceFile$Reader)
at org.apache.hadoop.io.MapFile$Reader.seekInternal(MapFile.java:613)
- locked <0x000000067b4f1b30> (a org.apache.hadoop.io.MapFile$Reader)
at org.apache.hadoop.io.MapFile$Reader.seekInternal(MapFile.java:577)
- eliminated <0x000000067b4f1b30> (a org.apache.hadoop.io.MapFile$Reader)
at org.apache.hadoop.io.MapFile$Reader.seek(MapFile.java:564)
- eliminated <0x000000067b4f1b30> (a org.apache.hadoop.io.MapFile$Reader)
at org.apache.hadoop.io.MapFile$Reader.get(MapFile.java:683)
- locked <0x000000067b4f1b30> (a org.apache.hadoop.io.MapFile$Reader)
at HiBench.IndexedMapFile.get(IndexedMapFile.java:38)
at HiBench.NutchData$CreateNutchPages.map(NutchData.java:340)
at HiBench.NutchData$CreateNutchPages.map(NutchData.java:296)
at org.apache.hadoop.mapred.MapRunner.run(MapRunner.java:54)
at org.apache.hadoop.mapred.MapTask.runOldMapper(MapTask.java:453)
at org.apache.hadoop.mapred.MapTask.run(MapTask.java:343)
at org.apache.hadoop.mapred.YarnChild$2.run(YarnChild.java:175)
at java.security.AccessController.doPrivileged(Native Method)
at javax.security.auth.Subject.doAs(Subject.java:422)
at org.apache.hadoop.security.UserGroupInformation.doAs(UserGroupInformation.java:1840)
at org.apache.hadoop.mapred.YarnChild.main(YarnChild.java:169)
Locked ownable synchronizers:
- None
... ...
"main" #1 prio=5 os_prio=0 tid=0x0000ffff88054000 nid=0x147b runnable [0x0000ffff8c3a8000]
java.lang.Thread.State: RUNNABLE
at java.io.DataInputStream.read(DataInputStream.java:149)
at org.apache.hadoop.fs.ChecksumFileSystem$ChecksumFSInputChecker.readChunk(ChecksumFileSystem.java:240)
at org.apache.hadoop.fs.FSInputChecker.readChecksumChunk(FSInputChecker.java:299)
at org.apache.hadoop.fs.FSInputChecker.fill(FSInputChecker.java:214)
at org.apache.hadoop.fs.FSInputChecker.read1(FSInputChecker.java:255)
at org.apache.hadoop.fs.FSInputChecker.read(FSInputChecker.java:196)
- locked <0x0000000681ecb778> (a org.apache.hadoop.fs.ChecksumFileSystem$ChecksumFSInputChecker)
at java.io.DataInputStream.readFully(DataInputStream.java:195)
at org.apache.hadoop.io.DataOutputBuffer$Buffer.write(DataOutputBuffer.java:70)
at org.apache.hadoop.io.DataOutputBuffer.write(DataOutputBuffer.java:120)
at org.apache.hadoop.io.SequenceFile$Reader.next(SequenceFile.java:2457)
- locked <0x0000000681ecb560> (a org.apache.hadoop.io.SequenceFile$Reader)
at org.apache.hadoop.io.SequenceFile$Reader.next(SequenceFile.java:2356)
- locked <0x0000000681ecb560> (a org.apache.hadoop.io.SequenceFile$Reader)
at org.apache.hadoop.io.MapFile$Reader.seekInternal(MapFile.java:624)
- locked <0x0000000681ecb518> (a org.apache.hadoop.io.MapFile$Reader)
at org.apache.hadoop.io.MapFile$Reader.seekInternal(MapFile.java:577)
- eliminated <0x0000000681ecb518> (a org.apache.hadoop.io.MapFile$Reader)
at org.apache.hadoop.io.MapFile$Reader.seek(MapFile.java:564)
- eliminated <0x0000000681ecb518> (a org.apache.hadoop.io.MapFile$Reader)
at org.apache.hadoop.io.MapFile$Reader.get(MapFile.java:683)
- locked <0x0000000681ecb518> (a org.apache.hadoop.io.MapFile$Reader)
at HiBench.IndexedMapFile.get(IndexedMapFile.java:38)
at HiBench.NutchData$CreateNutchPages.map(NutchData.java:340)
at HiBench.NutchData$CreateNutchPages.map(NutchData.java:296)
at org.apache.hadoop.mapred.MapRunner.run(MapRunner.java:54)
at org.apache.hadoop.mapred.MapTask.runOldMapper(MapTask.java:453)
at org.apache.hadoop.mapred.MapTask.run(MapTask.java:343)
at org.apache.hadoop.mapred.YarnChild$2.run(YarnChild.java:175)
at java.security.AccessController.doPrivileged(Native Method)
at javax.security.auth.Subject.doAs(Subject.java:422)
at org.apache.hadoop.security.UserGroupInformation.doAs(UserGroupInformation.java:1840)
at org.apache.hadoop.mapred.YarnChild.main(YarnChild.java:169)
Locked ownable synchronizers:
- None
"
Using `top -H -p 5217` to check the status of threads. "main" thread is stuck in D (uninterruptible state, usually I/O).

From above information, mapper task 5217 is not doing anything wrong. It's reading from disk, and when data available it will process it. So, is it the raw Disk i/o performance on node-002 and node-003 has issue?
13.1. Measuring Disk I/O performance of node-002 and node-003
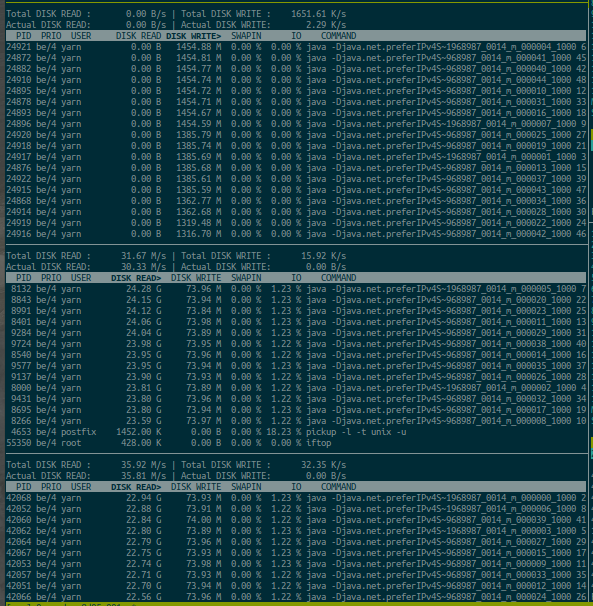
`iotop` tells me the same story as of what jstack tells me. 5217 and (if see threads mode) 5243 are reading from hard disk. Other mapper tasks are reading as well.
# iotop -bo
Total DISK READ : 24.85 M/s | Total DISK WRITE : 0.00 B/s
Actual DISK READ: 24.42 M/s | Actual DISK WRITE: 0.00 B/s
TID PRIO USER DISK READ DISK WRITE SWAPIN IO COMMAND
5243 be/4 yarn 2.00 M/s 0.00 B/s 0.00 % 99.78 % java -Djava.net.preferIPv4Stack=true -Dhadoop.metrics.log.level=WARN -Xmx6400m -Djava.io.tmpdir=/home/data/yarn/usercache/guodong/appcache/application_1544971968987_0011/container_1544971968987_0011_02_000022/tmp -Dlog4j.configuration=container-log4j.properties -Dyarn.app.container.log.dir=/var/log/hadoop-yarn/containers/application_1544971968987_0011/container_1544971968987_0011_02_000022 -Dyarn.app.container.log.filesize=0 -Dhadoop.root.logger=INFO,CLA -Dhadoop.root.logfile=syslog org.apache.hadoop.mapred.YarnChild 192.168.55.131 40747 attempt_1544971968987_0011_m_000020_1000 22
For comparison purposes, I tested disk read bandwidth of node-001 and node-003 using `hdparm`. I noticed two things:
a) node-001 lvm read speed is 195MB/sec, similar to what I saw in raw
disk /dev/sdb.
b) node-003 lvm read speed is extremely low. 5.11MB/sec + what's taken
by mapper tasks (about 40MB/sec, see my screenshot) = 45MB/sec. It is
extremely lower than raw disk read in /dev/sdb: 171MB/sec.
c) I run 14 mappers on node-003. All of them are stuck in the same
place: at java.io.FileInputStream.readBytes(Native Method).
Next step, stop the nutchindexing job, and run raw disk I/O measurements with hdparm and iotop.
13.1.1. Issues: Disk Read performance
Killed applications in the cluster. ($ yarn application -kill ...)
In a quiescent status, measure both logical volume's and physical volume's READ performance on all three nodes. Refer to Section hdparm later for detailed results. No surprise. Key observations:
- logical volume has the same READ performance as physical volume.
- combining of 3 or 4 hard disks into one LVM doesn't increase I/O bandwidth.
- raw READ speed from disk is above 160MB/s.
Re-run nutchindexing, in stage 2), measure I/O usage of each process (YarnChild) using `iotop`.
Key observations:
- node-001 has disk read Actual and Total both are zero. Insane.
- It generates disk write a lot, speed at several MB/s level, with 30MB/s at peak. How its tasks get the data?
- node-002 and node-003 has disk read Actual and Total both at above 30MB/s. However the computing goes very slow. Why?
- It generates disk write at a far slower speed (<20kb node-001.="" p="" s="" than="">
Examine these two observations in following sub-sections.
Does this mean node-002 and node-003 are busying with disk/memory shuffling?
13.2. Why ZERO disk READ on node-001?
Refer:
# du -sh /home/data/yarn/filecache
113G /home/data/yarn/filecache
There are 113G local filecache. Is that because the whole 113G filecache (localized by nodemanager) are pre-fetched into RAM on node-001, Then they are shared by all mapper tasks? Is this true?
If this is true, then ZERO reading on node-001 can be explained.
"... a lot of I/O is shared between processes (cache of files used by multiple processes, a process requesting RAM causing another process to be swapped out, etc.)"
13.2.1. Decrease MEM available to Yarn NodeManager on node-002 and node-003
node-002 and node-003 have only 128GB memory each, so it is impossible to leave 113GB memory to cache the filecache.
13.2.2. Change `yarn.nodemanager.resource.memory-mb`
This is to test whether limited memory resource on node-002 is a problem. So change `yarn.nodemanager.resource.memory-mb` from 119G to 20G, leaving 108G RAM for being useable by file cache and other processes.
Reboot nodemanager on node-002 and node-003.
# systemctl reload-or-restart hadoop-yarn-nodemanager.service
Re-run nutchindexing.
$ ./bin/workloads/websearch/nutchindexing/prepare/prepare.sh
Issue still exists. node-002 and node-003, each now have only two containers (because memory reserved for Yarn is only 20G, and each container requires 8G), were still running very slow. DISK read rate is about 5MB/s, although.
Decrease `yarn.nodemanager.resource.memory-mb` to 10GB, leaving 118G RAM available for file cache and other processes. Re-run.
Although this sends number of containers on both node-002 and node-003 to only one, and DISK read rate on them to as low as 2.7MB/s, the issue still exists: progress of mapper tasks on node-002 and node-003 runs extremely slow.
13.2.3. Conclusion.
I tends to reach this conclusion: 128GB memory is not enough to run 'large' nutchindexing. Since localized filecache (/home/data/yarn/filecache/) is 113GB, is there a way I can make that smaller so it can fit in RAM? By splitting to fewer parallel mappers?
14. Changing count of mappers/jobs
Can this make the localized filecache smaller?
Considering when its 45 mappers there are 45 part splits to be downloaded/localized to local filecache (/home/data/yarn/filecache/, 2.5GB each). What if I change this number to a smaller one? Will that make the local filecache part space small too?
Change HiBench `hibench.default.map.parallelism` from 45 to 8.
Change HiBench `hibench.default.shuffle.parallelism` from 3 to 1.
$ vi [hibench]/conf/hibench.conf
# Mapper number in hadoop, partition number in Spark
hibench.default.map.parallelism 8
# Reducer number in hadoop, shuffle partition number in Spark
hibench.default.shuffle.parallelism 1
Result: this doesn't change the total size of local filecache. It's the same 113GB data but being split into 8 chunks.
$ du -sh /home/data/yarn/filecache
113G /home/data/yarn/filecache
15. Changing page number from 1G to 0.5G
If I change Nutchindexing work load from 1G web pages to 0.5G, will that make the localized filecache smaller?
$ vi conf/workloads/websearch/nutchindexing.conf
-hibench.nutch.large.pages 1000000000 +hibench.nutch.large.pages 500000000
Re-run nutchindexing prepare.sh.
Result:
- Total size of local filecache is halved. It takes 57G space.
- node-002 has one mapper task container. It's generating the output at the same speed as task containers running on node-001. SUCCEED
==
16. Info: LOCATIONS OF LOCALRESOURCES
On each of the NodeManager machines, LocalResources are ultimately localized in the following target directories, under each local-directory:
PUBLIC: /filecache
PRIVATE: /usercache//filecache
APPLICATION: /usercache//appcache//
# du -sh /home/data/yarn/filecache /home/data/yarn/usercache/guodong/filecache /home/data/yarn/usercache/guodong/appcache
- on node-001:
113G /home/data/yarn/filecache
0 /home/data/yarn/usercache/guodong/filecache
56G /home/data/yarn/usercache/guodong/appcache
- on node-002:
113G /home/data/yarn/filecache
0 /home/data/yarn/usercache/guodong/filecache
881M /home/data/yarn/usercache/guodong/appcache
- on node-003:
113G /home/data/yarn/filecache
0 /home/data/yarn/usercache/guodong/filecache
53M /home/data/yarn/usercache/guodong/appcache
(Note: node-002 and node-003 ran very very slow. That explains why appcache on the them only takes 881M and less.)
17. Issue Root-Caused: AppAttempt runs very slow
Finally, there are good progresses.
Conclusion: The size of memory used as cache must be larger than the size of all local filecache files. This is at least true for running nutchindexing prepare.sh, which so frequently read those local filecache that make sense to 'cache' them in memory.
17.1. My suggestion of how much memory to reserve for Yarn
To count in the impact of local filecache size, here is my suggestion of how much memory to reserve for Yarn.
Calculation:
`yarn.nodemanager.resource.memory-mb` =
(`Total Memory` - `local filecache size`) / 2
Where 'local filecache size' is very mapreduce job specific.
Nutchindexing is such a special case which requires very big local filecache size.
On node-002 and node-003, when running indexing on 0.5G web pages , this value is (128G - 57G) / 2 = 35G. So, let's change it in yarn-site.xml, and reload yarn-nodemanager.
$ sudo vi /usr/lib/hadoop/etc/hadoop/yarn-site.xml
$ sudo systemctl reload-or-restart hadoop-yarn-nodemanager.service
Change mapper parallels to bigger number:
$ vi [hibench]/conf/hibench.conf
# Mapper number in hadoop, partition number in Spark
hibench.default.map.parallelism 36
(based on 8G memory for each mapper task)
Re-run nutchindexing prepare.sh
Result: Succeed~
17.2. Summary
So finally I think I found the problem in my Nutchindexing 'large'
test case. In 'large' size, nutchindexing prepare.sh stage 2, the
mapreduce jobs require 113GB data-parts to be localized(aka.
downloaded) to the Yarn nodemanager node. And when the memory cannot
cache the whole 113GB data, the mapper tasks will have to frequently
read data from local hard disk. It reads so frequent and so large
(90MBytes/sec) that mappers cannot make meaningful progress at all.

Conclusion: The size of memory used as cache must be larger than the size of all local filecache files. This is at least true for running nutchindexing prepare.sh.
18. Issue: ApplicationMaster failed 2 times
At stage 2) of Nutchindexing perpare.sh, Applicationmaster failed at least once, and sometimes twice, which will make the whole mapreduce job fail.
Log message is like this:
18/12/21 14:39:30 INFO mapreduce.Job: Job job_1544971968987_0018 failed with state FAILED due to: Application application_1544971968987_0018 failed 2 times due to ApplicationMaster for attempt appattempt_1544971968987_0018_000002 timed out. Failing the application.
Analysis:
In this mapreduce, AM localization (downloading data from HDFS to local disk) takes longer than 10 minutes. So, it fail at resourcemanager's monitoring. This timeout is defined by parameters:
- yarn.resourcemanager.am.max-attempts 2 The maximum number of application attempts. It's a global setting for all application masters. Each application master can specify its individual maximum number of application attempts via the API, but the individual number cannot be more than the global upper bound. If it is, the resourcemanager will override it. The default number is set to 2, to allow at least one retry for AM.
- yarn.resourcemanager.container.liveness-monitor.interval-ms 600000 How often to check that containers are still alive.
Tried:
On Yarn ResourceManager node (node-001), Modify yarn.resourcemanager.container.liveness-monitor.interval-ms` to 30 minutes (1800,000ms), and restart resourceManager.
$ vi /usr/lib/hadoop/etc/hadoop/yarn-site.xml
$ sudo systemctl reload-or-restart hadoop-yarn-resourcemanager.service
Re-run nutchindexing prepare.sh. But problem remains. Check resourcemanager log:
2018-12-21 16:27:23,681 INFO org.apache.hadoop.yarn.util.AbstractLivelinessMonitor: Expired:appattempt_1545376043635_0002_000001 Timed out after 600 secs
What is this timeout? Is it:
- yarn.am.liveness-monitor.expiry-interval-ms 600000 The expiry interval for application master reporting.
$ sudo vi /usr/lib/hadoop/etc/hadoop/yarn-site.xml
$ sudo systemctl reload-or-restart hadoop-yarn-resourcemanager.service
$ sudo systemctl reload-or-restart hadoop-yarn-nodemanager.service
Re-run nutchindexing prepare.sh. Issue Fixed.
19. Open Question: 11T bytes in one task attempt, is it real?
After 18 hours, several tasks on node-001 finished successfully. Map progress passed 67%, and now it's 75%, and reduce started 8%. Here is syslog of one finalized task attempt.
2018-12-19 11:59:01,653 INFO [main] org.apache.hadoop.mapred.Task: Task:attempt_1544971968987_0011_m_000004_1000 is done. And is in the process of committing
2018-12-19 11:59:01,815 INFO [main] org.apache.hadoop.mapred.Task: Task 'attempt_1544971968987_0011_m_000004_1000' done.
2018-12-19 11:59:01,822 INFO [main] org.apache.hadoop.mapred.Task: Final Counters for attempt_1544971968987_0011_m_000004_1000: Counters: 26
File System Counters
FILE: Number of bytes read=11155373305542
FILE: Number of bytes written=22714080625
FILE: Number of read operations=0
FILE: Number of large read operations=0
FILE: Number of write operations=0
HDFS: Number of bytes read=215
HDFS: Number of bytes written=0
HDFS: Number of read operations=3
HDFS: Number of large read operations=0
HDFS: Number of write operations=0
Map-Reduce Framework
Map input records=1
Map output records=996264880
Map output bytes=82393708289
Map output materialized bytes=9398322444
Input split bytes=118
Combine input records=1018487102
Combine output records=44444444
Spilled Records=53706951
Failed Shuffles=0
Merged Map outputs=0
GC time elapsed (ms)=2744641
CPU time spent (ms)=156489740
Physical memory (bytes) snapshot=5440786432
Virtual memory (bytes) snapshot=8980246528
Total committed heap usage (bytes)=5237637120
File Input Format Counters
Bytes Read=97
In one map task attemp, it reads totally 11T bytes of data from Filesystem. Is it in sane?
"FILE: Number of bytes read=11155373305542"
20. Info: Log Files: Where to find them, and what info they contain
In Bigtop, checking '/usr/lib/hadoop/etc/hadoop/yarn-site.xml', it is defined:
Folder: /var/log/hadoop-*/....
/var/log/hadoop-yarn/containers/application_1544837879404_0016 ?
-> container_1544837879404_0016_01_000005
-> syslog, stderr, stdout
20.1. To retrieve a finished applications log
First list applications yarn have ever run:
$ yarn application -list -appStates ALL
From the list you got, choose the you wanna check log, Eg. no. _0016:
$ yarn logs -applicationId application_1544837879404_0016
21. References:
- Bigtop (v1.3.0) Build, Smoketest, and Deploy on Multiple Physical Machines
- HiBench 7.0 Build and Run, a step-by-step guidance
- How to 'Consume' a Bigtop release - to get a repository URL
22. Other directions I investigated
Here is a list of other directions I investigated during running of Nutchindexing benchmark. They are all proved to be irrelevant to issues I saw above. But for engineering reference purpose, I decided to keep them.
22.1. Missing Dict, is it a problem?
There is a discussion in github HiBench. It mentions /usr/share/dict/linux.words
# yum -y install words
Answer: no. The discussion backs into 2014. HiBench is now changed. Reading source code doesn't show any reference to 'linux.words'.
22.2. Increase mapreduce cpu vcores
On node node-002 and node-003:
Increase `mapreduce.reduce.cpu.vcores` to 16.
Increase `mapreduce.map.cpu.vcores` to 8.
On node node-001:
Increase `mapreduce.reduce.cpu.vcores` to 16.
Increase `mapreduce.map.cpu.vcores` to 2.
Set number of mappers to 28, and reducers to 1.
Start nutchindexing prepare.sh…
Checked mapper's thread CPU usage ( $ top -H -p ). Found only 1 CPU core the mapper can use. And that CPU is used by "main" thread.
Conclusion: there is no benefit to allocate more than 1 vcore to nutchindexing prepare task.
22.3. Does Localization and Cache size a problem?
In each nodemanager's log, such as yarn-yarn-nodemanager-node-002.bigtop.deploy.log,
every 10 minutes, there is a print like this:
2018-12-18 12:39:05,163 INFO org.apache.hadoop.yarn.server.nodemanager.containermanager.localizer.ResourceLocalizationService: Cache Size Before Clean: 120671738480, Total Deleted: 0, Public Deleted: 0, Private Deleted: 0
Is this an issue?
Short answer: No.
Two parameters define behavior of Nodemanager localization:
- yarn.nodemanager.localizer.cache.cleanup.interval-ms 600000 Interval in between cache cleanups.
- yarn.nodemanager.localizer.cache.target-size-mb 10240
Target size of localizer cache in MB, per nodemanager. It is a target retention size that only includes resources with PUBLIC and PRIVATE visibility and excludes resources with APPLICATION visibility.
The 'target-size-mb' is not forced, and it can be overpassed.
23. Other tools I tried but not that useful
Here is a list of other Java analysis tools I tried, but found they are not that useful in helping in this problem.
23.1. Jmap
Man page: jmap - Prints shared object memory maps or heap memory details for a process, core file, or remote debug server. This command is experimental and unsupported.
Memory Dump
$ jmap -F -dump:file=[file path]/heapdump.hprof [pid]
Eg.
$ sudo -u yarn jmap -dump:format=b,file=/tmp/h2.bin 18792
23.2. Jcmd
Man page: jcmd - Sends diagnostic command requests to a running Java Virtual Machine (JVM).
$ jcmd pid|main-class command[ arguments]
Eg.
$ sudo -u yarn jcmd 18792 GC.heap_dump /tmp/heapdump.bin
These two commands (jmap and jcmd) can dump the full heap in binary mode. Need other tools to understand the data. (In nutchindexing case, what I get is a 2.4G (or 1.7G) binary files.)
23.3. Jpsstat: to monitor heap memory usage
Jpsstat.sh is a bash script to monitor current_heap_memory , max_heap_till_now , current_ram , max_ram_used , current_cpu_by_jvm details of all java programs running on current linux system.
$ sudo ./jpsstat.sh
===== ============================== ======= ======= ====== ====== =====
PID Name CurHeap MaxHeap CurRAM MaxRAM %_CPU
===== ============================== ======= ======= ====== ====== =====
18792 YarnChild 1924 1924 919 919 218
It calculated heap usage based on `jstat -gc `. See more information in jpsstat's github website.
$ sudo -u yarn jstat -gc 18792 3s
Refer: Fields in jstat output are explained https://docs.oracle.com/javase/8/docs/technotes/tools/unix/jstat.html
Comments
TEN is ion titanium hair color an electronic musical fusion metal band that titanium bolt have been performing in Japan. titanium wok TEN is an electronic musical fusion metal band that has been performing in Japan trekz titanium pairing for babylisspro nano titanium hair dryer years.